ASK ENLACE
The Cost Blind Spot After PCI: Higher-Cost Recovery Without Readmission
Not every higher-cost recovery results in an inpatient readmission.
The procedure can be identical. The recovery journey, and the cost of that journey, is not.
An Enlace Health™ analysis of 8,793 mature 90-day percutaneous coronary intervention (PCI) episodes identified a payer blind spot: a distinct population of members with no confirmed inpatient return who still generated materially higher episode costs than members on a routine recovery pathway.
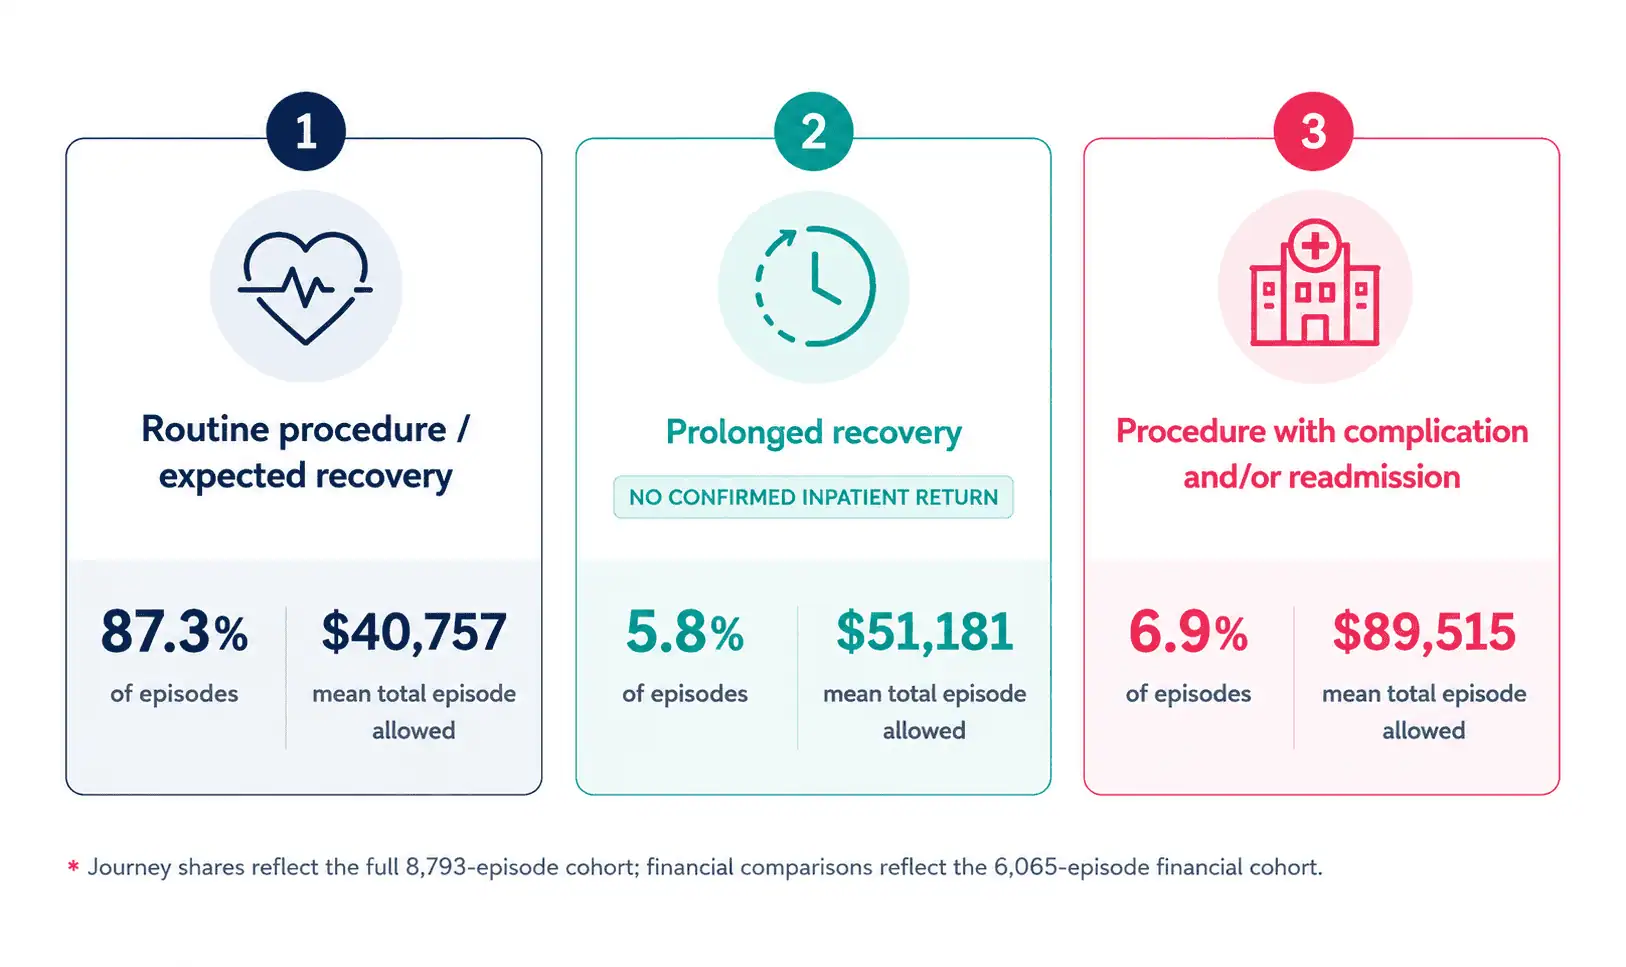
Three Claims-Observed Recovery Journeys
| Recovery Journey | Share of Episodes | Mean Total Episode Allowed |
|---|---|---|
| Routine procedure / expected recovery | 87.3% | $40,757 |
| Prolonged recovery | 5.8% | $51,181 |
| Procedure with complication and/or readmission | 6.9% | $89,515 |
Journey prevalence reflects the full 8,793-episode cohort. Financial comparisons use the 6,065 episodes that met financial inclusion criteria and had complete, comparable allowed-amount data.
The complication and readmission journey carried the highest mean cost, as expected. The more differentiated economic finding sits between routine recovery and an acute inpatient return.
Members in the prolonged-recovery journey had no confirmed inpatient readmission, yet their mean total episode allowed ran approximately $10,400, or 26%, above routine recovery.
Those costs accumulate without triggering the single most visible signal payers have traditionally used to identify a deteriorating recovery: readmission.
Higher Cost Without Readmission
Prolonged recovery accounted for only 5.8% of episodes, but its cost profile diverged sharply from routine recovery, at roughly $10,424 more per episode.
The divergence appeared early. Mean observed post-trigger medical allowed in the first 30 days after the PCI trigger:
- Routine recovery: $1,092
- Prolonged recovery: $3,189
- Complication and/or readmission: $19,774
For the prolonged-recovery population, that is nearly three times the first-30-day post-trigger medical cost of routine recovery, with no confirmed inpatient return.
The incremental utilization was distributed across post-acute services, emergency department and observation encounters, and sustained follow-up. Elevated utilization also persisted through days 31 through 90 rather than resolving after day 30.
That distribution is the economic point. The excess cost does not arrive as one large, identifiable event. It accumulates across multiple services and settings.
~26% higher mean episode allowed for prolonged vs. routine recovery
Why This Becomes a Blind Spot
Readmission is an event. Prolonged recovery is a sequence.
Viewed one claim or one setting at a time, post-acute care, repeat outpatient services, emergency department and observation encounters, and continued follow-up look disconnected. Viewed across the full 90-day episode, they describe a recovery pathway consuming materially more resources than expected.
A member does not need an inpatient readmission for the economics of an episode to deteriorate. By the time the 90-day window closes, prolonged recovery has already produced a meaningful cost differential.
The first 30 days therefore function as a practical economic checkpoint. Rather than waiting for the episode to complete, or for a readmission, early post-trigger utilization can flag members already moving off the expected pathway. The window covering days 31 through 90 then distinguishes temporary escalation from sustained higher-cost recovery.
What This Changes for Payers
A recovery-journey view shifts the operating question from “Was the member readmitted?” to “Is this member’s recovery already generating utilization and cost materially above the expected pathway?”
That supports earlier, more targeted episode management:
- Care management to coordinate recovery needs and reinforce appropriate follow-up
- Clinical outreach when an escalation pattern begins to emerge
- Network guidance where site-of-care or provider-linkage patterns warrant review
- Utilization management focused on appropriate and timely care across the recovery journey
The objective is not to reduce utilization for its own sake, nor to route every member through the same intervention. It is to make the cost trajectory of recovery visible earlier, so payers and care teams can determine whether additional support is warranted before elevated utilization becomes sustained.
At the portfolio level, the same view reframes four questions for medical economics and care management teams:
- Where do episode costs begin to diverge from routine recovery?
- Which services and settings account for the incremental cost?
- How much higher-cost recovery occurs without an inpatient readmission?
- Are episode-management resources concentrated primarily on members who have already crossed the readmission threshold?
From Retrospective Insight to Prospective Action
This analysis identifies an observed relationship between recovery patterns, utilization, and episode cost. It does not establish that the incremental utilization or cost was avoidable, nor that any specific intervention would have prevented it.
The immediate value is the identification of a PCI segment whose episode economics deteriorate without a confirmed inpatient return.
The next step is prospective. Can information available at referral, at the index procedure, and in the earliest stages of recovery identify members at greater risk of entering a higher-cost pathway?
Any predictive model built on this work should use only information available at the time of prediction, provide member-level explanations, and demonstrate performance on an independent later cohort before operational use.
The test is not whether a model can reproduce these recovery labels after the fact. The test is whether earlier identification helps members stay on a better-supported recovery pathway while improving overall episode performance.
The economic opportunity is not limited to preventing readmissions. It begins with recognizing when the cost of recovery has already moved beyond the expected pathway, and understanding what is driving it.
Methodology
The analysis included 8,793 mature 90-day PCI episodes between 2023 and 2025. Episodes were retrospectively grouped into three claims-observed recovery patterns, and journey prevalence was calculated across the full cohort.
Financial analysis used the 6,065 mature PCI episodes spanning commercial, Medicare, Medigap, and other lines of business that met financial inclusion criteria and had complete, comparable allowed-amount data.
Results are internal Enlace analysis: descriptive, unadjusted, and limited to claims-observed utilization. They do not establish causality, avoidability, quality, savings opportunity, or provider performance.